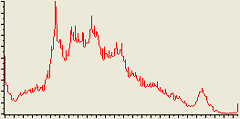
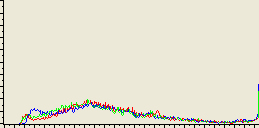
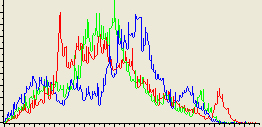
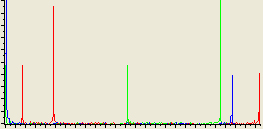
The color histogram shows the intensity of the three color components red, green and blue each from left to right from 0% to 100%. If one color is overexposed, a sharp full line at the far right will appear.
For an image it is the representation of the distribution of colors. It is a graph counting the number of pixels at each level between 0% and 100% for each of the three basic colors.
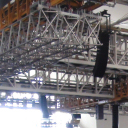
| see below color histogram for this image: | | |
|
|
|
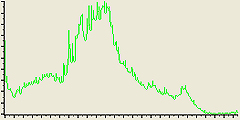
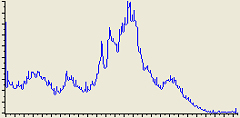
| Histogram red | Histogram green | Histogram blue |
| from left 0% 'totally dark' -to- right 100% 'totally bright' | ||
 |
 |
 |
 |
 |
 |
|
 |
 |
 |
 |
 |
 |
 |
 |
 |
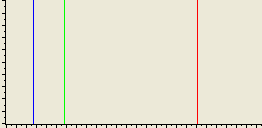
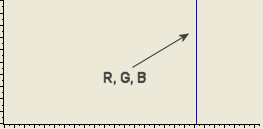
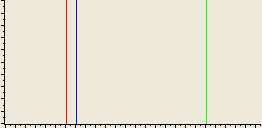
A neutral grey image taken by photograph or video should be displayed in the three-color histogram with a single line for each color at exactly the same position. If not, the white balance isn't correct.
|
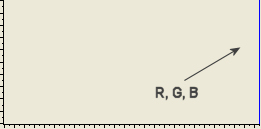
| correct white balance R, G, B at the same position |
 |
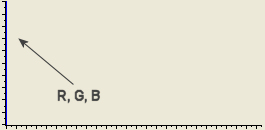
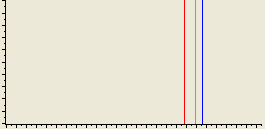 | incorrect white balance R, G, B at different positions |