Audio Level Meters
General
Audio level meters indicate audio levels integrated over a certain time period. Depending on the in built time constant that determines the integration time of the average signal, the displayed levels are different. For instance older analog peak meters don't show the shortest transients and peaks. This was not necessary because of 'softer' analog distortion. Digital devices with a sharp and precise clipping point at 0dBFS are not forgiving anymore and faster instruments are needed to indicate these shortest peaks. The RMS (root mean square) value is used to get a measurement that is close to the perceived loudness. This is possible and logical because the RMS level represents the 'energy content' of a wave form. To get the RMS value out of a waveform that is not just a sine wave but a continuously changing waveform a time constant must be implemented. The relationship between the RMS and the instantaneously measured voltage depends on the time constant of the RMS detection circuit.
 See: Crest Factor and Root Mean Square.
The RMS value is also used as the basis for average level measurements displayed by a VU meter and peak to peak levels are displayed on a PPM (Peak Program Meter). A VU meter integrates the audio signal over 300 milliseconds and a PPM integrates the measured signal over only 10ms.
The classical VU meter is very slow in the integration and don't show peaks at all. They were very helpful because the VU meter represents approximately the perceived loudness of an audio signal.
The indicated level of different meter types with the same signal (with a higher crest factor) could differ of up to 20dB!
Every meter is characterized by a specific ballistics, a 'fall time' that indicated how fast the optical level indication drops after the signal is absent, for instance "2 seconds/24 dB".
In Europe the PPM (Peak Programme Meter) is recommended and in the US the mostly used instrument is still the VU meter. The analog PPM meter is specified in IEC 268-10, the digital PPM meter is specified in IEC 268-18.
VU Meter ('Volume Unit')
The VU meter was invented in by John Miller and introduced in 1938/39 by Weston Electrical Instrument Co. The meter was originally designed to work only on terminated 600 ohm balanced lines. Because the instrument itself has an impedance of 3k9 ohm it must be used with a 3k6 ohm resistor in series on a terminated 600 ohm line so that the sum of 3k6 ohm and 600 ohm equal the inner impedance of the instrument of 3k9 ohms. This is the electro mechanical basis of the instrument.
The VU meter is designed to have a purposefully designed slow time-dependent response (300 millisec integration time) to indicate the "average" sound level corresponding with the perceived loudness and not peaks and very short impulses. It was developed empirically based on test with human listeners. Because of the slow response the meter wasn't able to indicate peaking or overloaded signals as long as the average signal was low enough. To have enough headroom the instrument was designed to have (or to show) at least 10 dB headroom over the 0VU marking. The instrument in the 1930s/40s was mainly designed for broadcast speech metering. The slow integration time worked very well with spoken words but for general purpose and music the VU meter is too inaccurate.

|  |
Another problem is the flat frequency response that is contrary to the perceived loudness over frequency. Very low bass parts are shown much higher as they are perceived by the human ear.
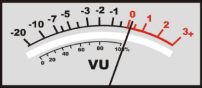
0VU can be calibrated to 0dBu, +4dBu or +8dBu. Complying with American National Standard C16.5-1942 a VU meter is calibrated for 0VU = +4dBu (sine wave).
For a "+4dBu" calibrated VU meter the maximum readable value is +3 = 7dBu.
The 0VU marking indicates today (see above) +4dBu, but originally +4dBm (the balanced 600 ohm line!).
Digital VU meters typically can be calibrated for:
+4dBu equals -20dBFS
+4dBu equals -18dBFS
+4dBu equals -16dBFS
+4dBu equals -12dBFS
Broadcast PPM (Peak Programme Meter)
In broadcast facilities in Europe the PPM is generally recommended. In the US the VU meter is still widely used. The analog PPM is specified in IEC 268-10, the digital PPM is specified in IEC 268-18.
The amount of short-time peaks indicated by the instrument is determined by the integration time of the PPM. The integration time is defined in the standard IEC 60268-10. It defines with what level a short 5kHz tone burst should be displayed by the instrument relatively to the real level. (The burst's indication should be 2dB below its real level tested at reference level.)
PPM normally uses an integration time of 10ms for the audio signal and then displays the result on a peak meter. The decay of the displayed level is determined by the return time. Typical return times of PPM instruments are 1,5 to 3,0 second/24dB decay with 'Type I' for shorter times and 'Type II' for longer times.
A "peak hold" at the instrument typically holds peaks above 'nominal' for 3 seconds and an "Peak LED" holds instantaneous peaks above -3dB for 3 seconds.
"Quasi Peak Level Meters" are specified in standard IEC 268-18. They have also a short integration time to indicate peaks sufficiently but they under-read peaks by 6 to 8dB. Because of that they give a good impression of the overall loudness of the metered signal.
| Programme Meter Type |
Recommendation |
Permitted Maximum Level (100%) |
Limit Level |
Scale Attack time (integration), time it takes to reach a certain signal percentage |
Decay time (fall-back) |
Invisible Peaks |
|
| EBU PPM Std (QPPM) |
EBU 3205E, IEC 268-10 / IIb |
+9 dB, +9 dBu |
|
-12 to +12 dB |
10 ms / 80% |
24 dB / 2.8 s = 8.6 dB/s |
+4 ... +6 dB |
| EBU Digi PPM (QPPM) |
EBU, IEC 268-18 |
-9 dBFS |
0 dBFS |
-40 to +0 dB |
5 ms / 80% |
20 dB / 1.7 s = 12 dB/s |
+3 ... +4 dB |
| DIN PPM (QPPM) |
DIN 45406, IEC 268-10/1, ARD Pfl.H.3/6 |
0 dBr, +9 dBu |
+16 dBr, +25 dBu |
-50 to +5 dB |
10 ms / 90%, 5 ms / 80% |
20 dB / 1.5 s = 13 dB/s |
+3 ... +4 dB |
| BBC PPM (QPPM) |
IEC 268-10 / IIa |
+8 dBu |
|
1 to 7 |
10 ms / 80% |
24 dB / 2.8 s = 8.6 dB/s |
+4 ... +6 dB |
| VU Meter |
ANSI C 16.5, IEC 268-17 |
0 VU, +0 dBu |
|
-20 to +3 dB |
300 ms / 90% |
300 ms / 10% |
+13 ... +16 dB |
 |
| Broadcast Level Metering |
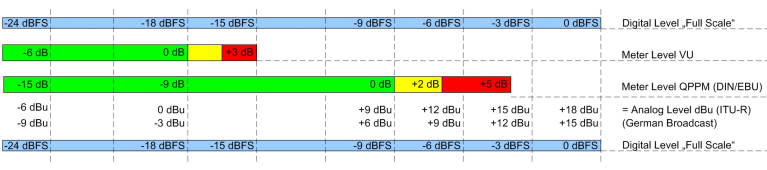
For digital audio levels in European broadcast facilities a level of +6dBu (analog audio, = 0dB on the instrument) corresponds to a digital level of -9dBFS. The maximum analog level of +15dBu corresponds to 0dBFS and is the absolute maximum level possible in the digital domain.
Quote from EBU Tech Note 3304 (2009):
" In R68-2000 [3] the EBU recommends that in digital audio equipment, its Members should use
coding levels for digital audio signals which correspond to an alignment level which is 18 dB below
the maximum possible coding level of the digital system, irrespective of the total number of bits
available.
Permitted Maximum Level on the other hand, equates to the peak modulation on a Radio link or
emission. It is set at a level 8 or 9 dB higher than Alignment level, depending on the regulatory
authority. Note that this nominal peak level for broadcast use is some 9 or 10 dB lower than the
peak digital modulation on �finished� commercial recordings, such as CD or DVD, although transient
excursions of peak signal up to 6 dB above PML may occur in practice. "
In the American market (and most of the UK) a slightly higher headroom is used because of the different characteristics of the VU meter. SMPTE defined a level of +20dBu as the corresponding level for 0 dBFS.
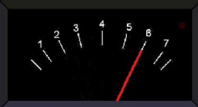
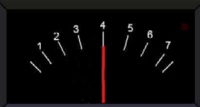
BBC or 'British' PPM Meter
The BBC is/was using the BBC PPM level meter. It is defined by the standard IEC IIA. The meter is designed not to show every short duration peak to better reflect the loudness of the broadcast program.
The needle for a one-channel instrument is white and each meter is labelled for their purpose: Stereo (A, B) red and green, Sum (M) white, Difference (S) yellow.
The reference tone is 900Hz or 1kHz with the level of 0dBu. On the BBC PPM this test tone should read 4.
 |
 |
 |
| BBC PPM |
Stereo (red/green) |
"4" for 0dBu |
On the BBC PPM each division between '1' and '7' is exactly 4dB. The maximum Programme Level (highest level with repeated consistent peaks) should be PPM 6 (needle at "6"). On a digital bargraph meter this level should be -10dBFS.
For a "+4dBu" calibrated VU meter the maximum readable value is "7" = 12dBu.
EBU (European Broadcasting Union) PPM
The EBU PPM is exactly the same as the British BBC PPM but with a different scale. The scale is a dB scale with 0dB at center (labelled 'TEST', there the BBC PPM is labelled '4'), with -4dB, -8dB, -12dB to the left and +4dB, +8dB and +12dB to the right. Above the +8dB mark it shows a +9dB marking as the maximum permitted level.
For calibration the center mark with 0dB (TEST) equals 0dBu and therefor -18dBFS RMS (EBU standard).
RMS - Peak Metering Definition / AES17-1998
There is an apparent discrepancy between the definition of the crest factor and the relationship between peak level and RMS level and the definition of VU/RMS metering.
See: Crest Factor and Root Mean Square.
0dBFS RMS is defined is equal to a maximum level (fullscale) sine wave of 997Hz. This would be also the equivalent of 0dBFS peak level. Because the crest factor of a sin wave is 3dB, the actual RMS value for a peak level of 0dBFS would be -3dBFS RMS. By setting this per definition to "0dBFS" it can be concluded that a rectangular wave form with a peak level of 0dBFS would be displayed as a RMS level of "+3dBFS". The standard says " .. because the definition of full scale is based on a sine wave, it will be possible with square-wave test signals to read as much as +3,01 dBFS. Square-wave signals at this level are not recommended because tilt or overshoot introduced by any filtering operations will cause clipping of the signal. "
If the full scale signal 0dBFS is defined as equivalent to a full scale square wave, all possible measurements are negative and a full scale sine wave would be -3dBFS RMS (0dBFS peak with a crest factor of 3dB). For instance Euphonix meters are calibrated this way.
If the full scale signal 0dBFS is defined a equivalent to a full scale sine wave, measurements could be over 0dBFS with the most extreme case of a square wave with +3dBFS. This is because the sine wave has a crest factor of 3dB and with a RMS value defined as 0dB this is actually the theoretical equivalent of +3dB peak level. This level is a theoretical value and not existing. But by defining that RMS and peak level at 0dBFS are the same, actually a 3dB gap is created between the peak and RMS level. A square wave with a crest factor of 0dB and a peak level of 0dBFS now should show a RMS level of +3dBFS. These conditions comply to the standards AES17-1998 and IEC61606. Dorrough meters are calibrated this way.
This controversy is generally accepted and the second method is mostly implemented because sine waves are used for calibration and the "square wave anomaly" should be accepted as a forgivable trade-off.
Different measurement devices have different methods of interpreting full scale. The digital and analog definition of RMS can differ by 3dB. The RMS level is 3dB higher than in the analog domain and a square wave signal can be '+3dBFS' !
