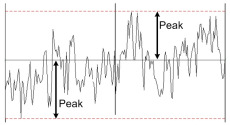
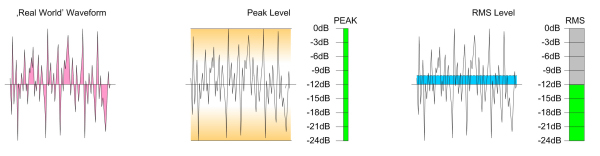
The crest factor is the ratio between peak level and RMS level of a wave form. It can be specified as voltage ratio or dB ratio. A high peak level compared to a low RMS level is caused for instance by sharp peaks in the waveform that don't contain much energy. These peaks do not last for a very long time. The peak level is defined by the highest peaks within the signal independently of the amount of energy they are representing and the RMS level is proportional to the amount of energy over a defined period of time in the signal. To get the RMS value out of a waveform that is not just a sine wave but a continuously changing waveform a time constant must be implemented. The relationship between the RMS and the instantaneously measured voltage depends on the time constant of the RMS detection circuit.
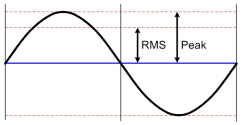
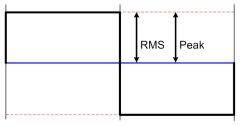
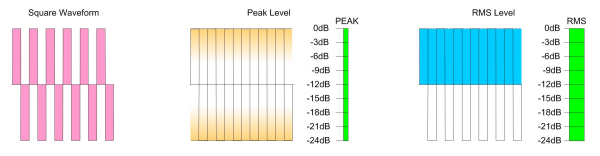
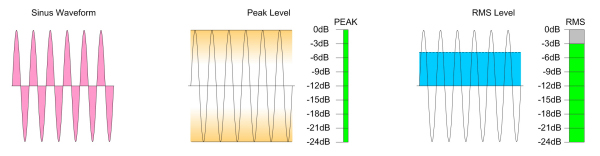
Well defined signals like sine and square waves have an exact ratio between peak level and RMS level and because of that an exactly defined crest factor. The RMS (root mean square) is based on the sine wave form. For a sine wave the peak level (maximum value of the wave form) is 1,41 times higher than the RMS level. For a ideal square wave the peak level is exactly the same as the RMS level.
| | |
| sine wave | ||
| ||
| square wave | ||
| ||
| pink noise | root mean square | |
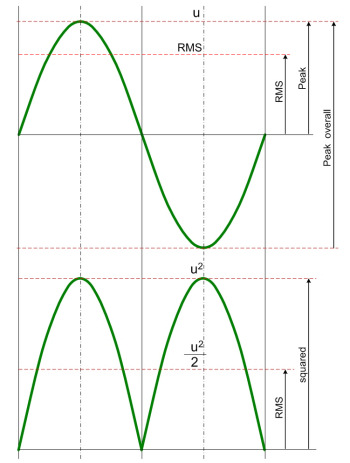
| sinus wave form formula a: peak value, f: frequency, t: time |
root mean square (RMS) value for a sine wave |
 |
 |
 |
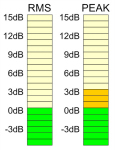
The peak level measurement on a digital meter is the sample-by-sample measurement. An in built ballistics makes sure that the indication fades slowly. A 0dBFS measurement definitely indicates that a sample is at full scale nonetheless what the samples before or afterwards are.
0dBFS RMS is defined by AES17 is equal to a maximum level (fullscale) sine wave of 997Hz. The frequency 997Hz was chosen because the sampling frequency should not be harmonically related to the measurement frequency. As soon as both frequencies are harmonically related some of the quantization levels are not used.
By defining 0dBFS RMS as the maximum sine wave the highest values must be equivalent of 0dBFS peak level. But because the crest factor of a sin wave is 3dB, the actual RMS value for a peak level of 0dBFS would be -3dBFS RMS. By setting this per definition to "0dBFS" it can be concluded that a rectangular wave form with a peak level of 0dBFS would be displayed as a RMS level of "+3dBFS". The standard says " .. because the definition of full scale is based on a sine wave, it will be possible with square-wave test signals to read as much as +3,01 dBFS. Square-wave signals at this level are not recommended because tilt or overshoot introduced by any filtering operations will cause clipping of the signal. "
If the full scale signal 0dBFS is defined as equivalent to a full scale square wave, all possible measurements are negative and a full scale sine wave would be -3dBFS RMS (0dBFS peak with a crest factor of 3dB). For instance Euphonix meters are calibrated this way.
If the full scale signal 0dBFS is defined a equivalent to a full scale sine wave, measurements could be over 0dBFS with the most extreme case of a square wave with +3dBFS. This is because the sine wave has a crest factor of 3dB and with a RMS value defined as 0dB this is actually the theoretical equivalent of +3dB peak level. This level is a theoretical value and not existing. But by defining that RMS and peak level at 0dBFS are the same, actually a 3dB gap is created between the peak and RMS level. A square wave with a crest factor of 0dB and a peak level of 0dBFS now should show a RMS level of +3dBFS. These conditions comply to the standards AES17-1998 and IEC61606. Dorrough meters are calibrated this way.
This controversy is generally accepted and the second method is mostly implemented because sine waves are used for calibration and the "square wave anomaly" should be accepted as a forgivable trade-off.
Because the above described situation as only the procedure to calibrate measurement devices it doesn't change physics or the behaviour of wave forms. A sine wave measured at a pure peak meter with 0dBFS will show on the associated AES17 calibrated RMS meter -3dBFS therefor again showing the crest factor of 3dB. .
| Wave Form | Image | Crest Factor | Meter |
| DC (direct current) |  |
voltage ratio: 1 0dB |
 |
| Square Wave | 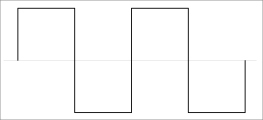 |
voltage ratio: 1 0dB |
|
| Sine Wave | 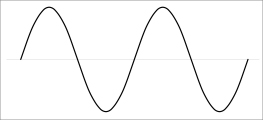 |
voltage ratio: 1,44 3dB |
 |
| Triangle Wave | 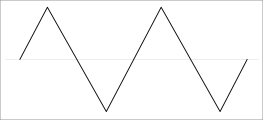 |
4.8dB | 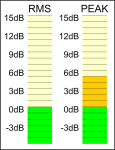 |
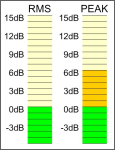
| Pink Noise | 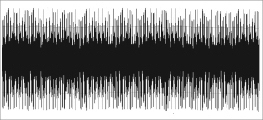 |
voltage ratio: about 3 about 12dB |
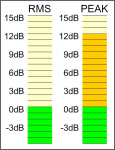 |
| AES Pink Noise amp test IEC 268-5 |
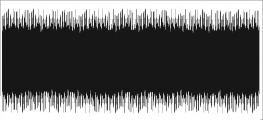 |
voltage ratio: 2 6dB |
 |
| Music | 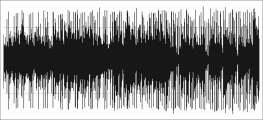 |
5dB to 20dB | 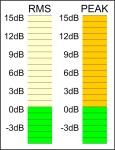 |
| Speech | 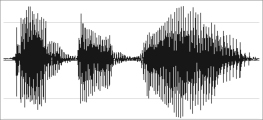 |
up to 15dB | |